Finally
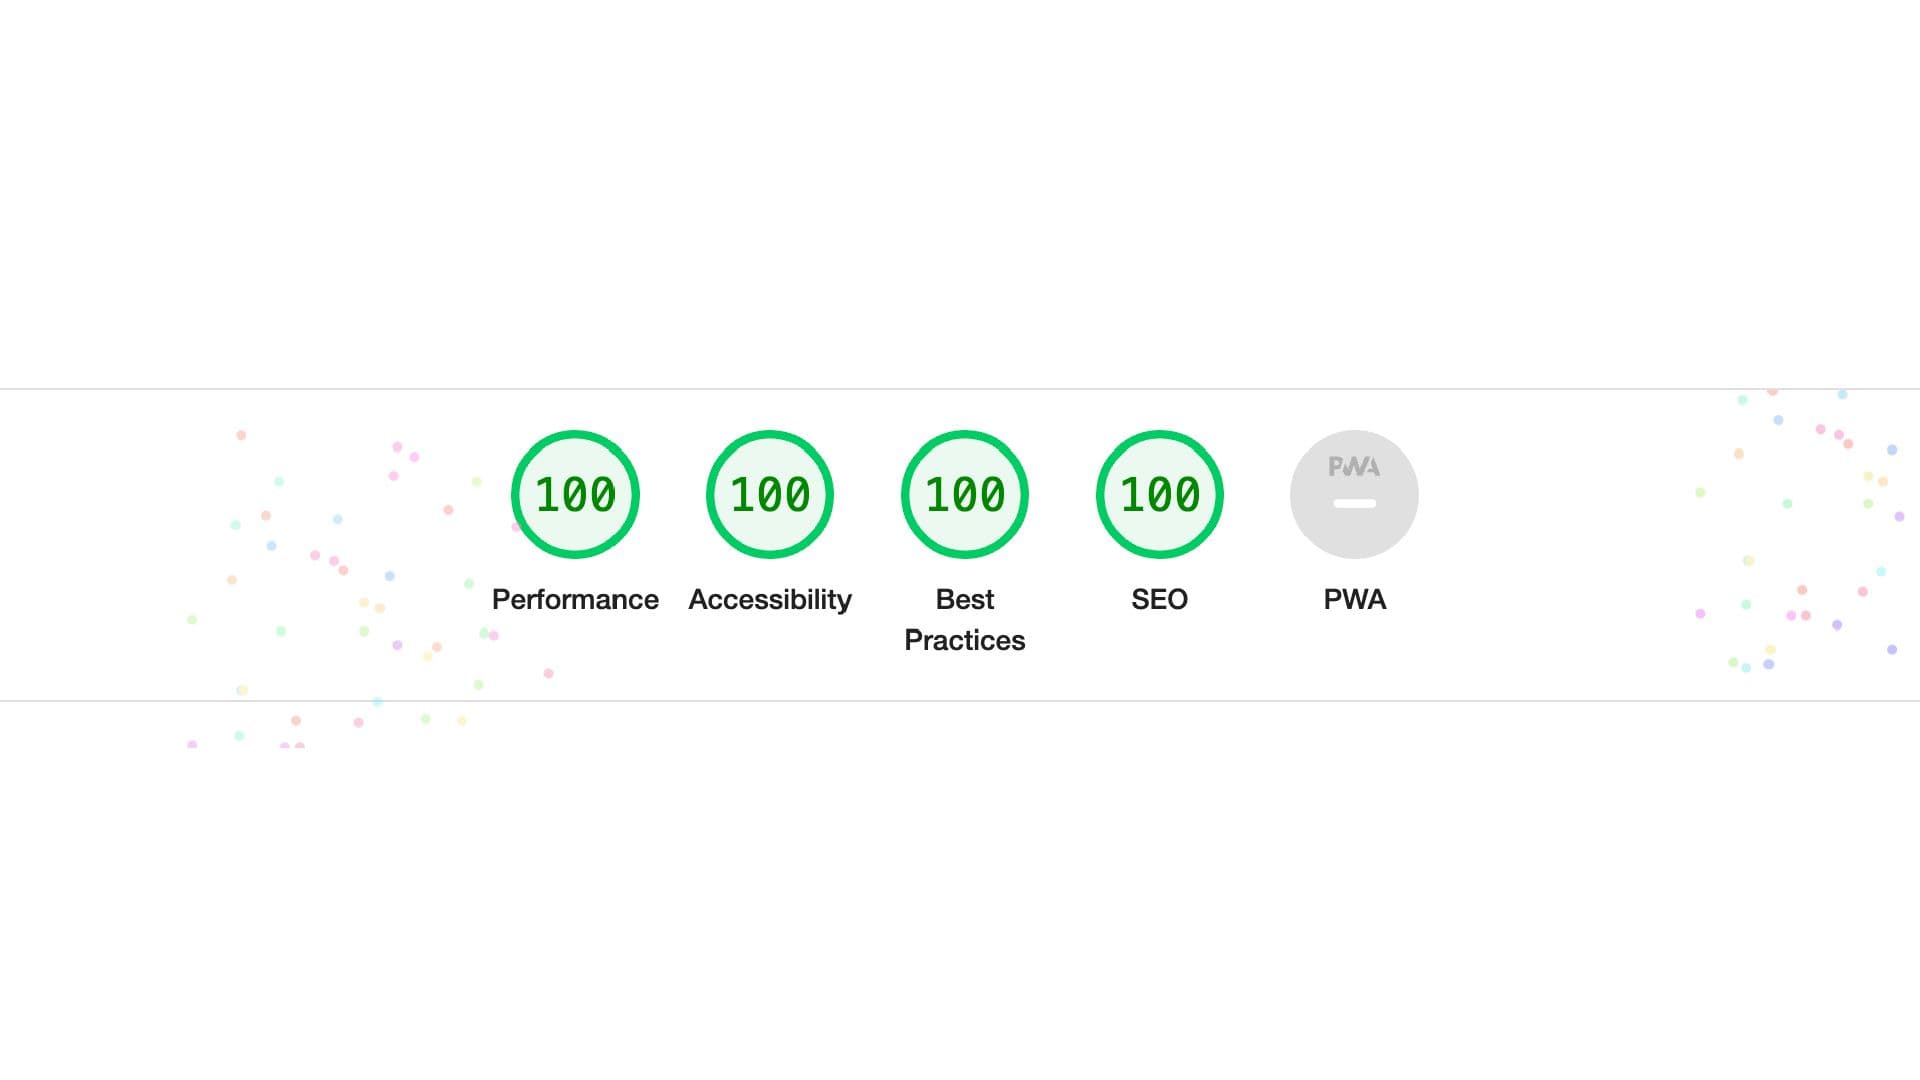
This website got 100 in Google Lighthouse on localhost environment.

Scored 100 on the localhost environment
Basically, the categories of Accessibility, Best Practices, and SEO are easily scored to achieve a perfect score of 100 in different testing environments. However, the category of Performance is difficult to achieve, as it involves dealing with concepts such as FCP, LCP, TBT, CLS, and Speed Index, which can be complex.
Nevertheless, it is important to acknowledge a crucial truth . Let's take a look at the image below, which shows scores ranging from 90 to 99 in the server environment. Unfortunately, achieving a perfect score of 100 in Google Lighthouse is not possible in this website. I can't even imagine what's the score in Google PageSpeed Insight ☹️
In this post, I will be focusing solely on performance metrics, as they offer greater potential for thorough auditing compared to other aspects. Additionally, I will provide concise and insightful recommendations based on my Page Google Lighthouse's result.

Performance is difficult to achieve 100 on the server environment
Performance Metrics

Performance Metrics Details
The Concept: First Contentful Paint (FCP), Largest Contentful Paint (LCP), Total Blocking Time (TBT), Cumulative Layout Shift (CLS), and Speed Index (SI).
The Google Lighthouse Documentation provides a concise and detailed explanation of these concepts. I will provide a paraphrased explanation of each.
Weight Balance
First Contentful Paint (10%)
Speed Index (10%)
Largest Contentful Paint (25%)
Total Blocking Time (30%)
Cumulative Layout Shift (25%)
What First Contentful Paint (FCP) measures?
How long the time it takes for the browser to display the initial portion of the webpage's DOM content once a user has accessed the page.
This includes images, non-white <canvas> elements, and SVGs present on the page. However, content within iframes is not taken into account when calculating FCP.
My adjusting:
- Be careful on fonts, like invisible fonts (normally)
- Sometimes, font can be large file with slow load times
What Largest Contentful Paint (LCP) measures?
Determining the moment when the largest content element within the visible portion of the webpage is rendered on the screen.
This provides an estimate of when the primary content of the page becomes visible to users. For further information on how LCP is calculated and defined, please refer to the detailed explanation provided in the documentation.
For an example, the LCP is the hero section on my homepage, as you can see the blurred background image.
My adjusting:
- Being careful on image and video dimensions and size.
- Responsive images
- Webp images
- Adding lazy loading on your image and video
- Being careful on web fonts, with larger file size
- Being careful on your CSS file
- Minifying the CSS file(delete all whitespace), compressing the file size as small as possible.
- *However, the CSS file of this website has not been compressed yet lol 😂😂😂 Sorry for that lazy action, I'm still editing the css and layout
- Loading the critical css file first
- Changing background image size in different devices
- Minifying the CSS file(delete all whitespace), compressing the file size as small as possible.
- Being careful on JS file,
- Removing unused code, file size as small as possible.
- Determining to optimize the third party with slow load.
- Optimizing long task in JS.
What Total Blocking Time (TBT) measures?
Quantifying the duration during which a webpage is unresponsive to user interactions like mouse clicks, screen taps, or keyboard presses.
The measurement involves identifying and summing up the blocking portions of all prolonged tasks that occur between the First Contentful Paint and the Time to Interactive.
Any task that runs for over 50 ms is considered a prolonged task, and the time exceeding 50 ms is considered the blocking portion. For instance, if Lighthouse identifies a task lasting 70 ms, the blocking portion would be calculated as 20 ms.
What is Cumulative Layout Shift (CLS)?
Representing the measurement of the most significant occurrence of layout shift scores among all unforeseen layout shifts that happen throughout a webpage's entire lifespan.
My adjusting:
- Being careful on width and height. (Read More...)
What Speed Index (SI) measures?
Evaluating the speed at which content is visually rendered during the loading of a webpage.
To calculate this metric, Lighthouse records a video of the page loading in the browser and analyzes the visual progression between frames.
The Speedline Node.js module is then utilized by Lighthouse to generate the Speed Index score.
For this blog, these are the most important metrics because this blog doesn't perform well in these metrics. 😂😂😂
My adjusting:
- Being careful on fonts, same situation as FCP
- Minimizing main thread work
- Reducing JS execution time


